Navigating the Monitoring Dashboard
The Monitoring Dashboard is your go-to tool for tracking media coverage in real-time across different categories like Online & Print, Social, and Broadcast. This guide will walk you through the key features, from filtering mentions to downloading reports.
Here's a video walkthrough of the entire process:
When you open the Monitoring Dashboard, you'll see all your alerts categorized by media type.
- Click Monitor: Select the account and then the alert you'd like to view.
- Viewing Active and Archived Mentions:
Active mentions are part of live monitoring and included in reports. Archived mentions are excluded.
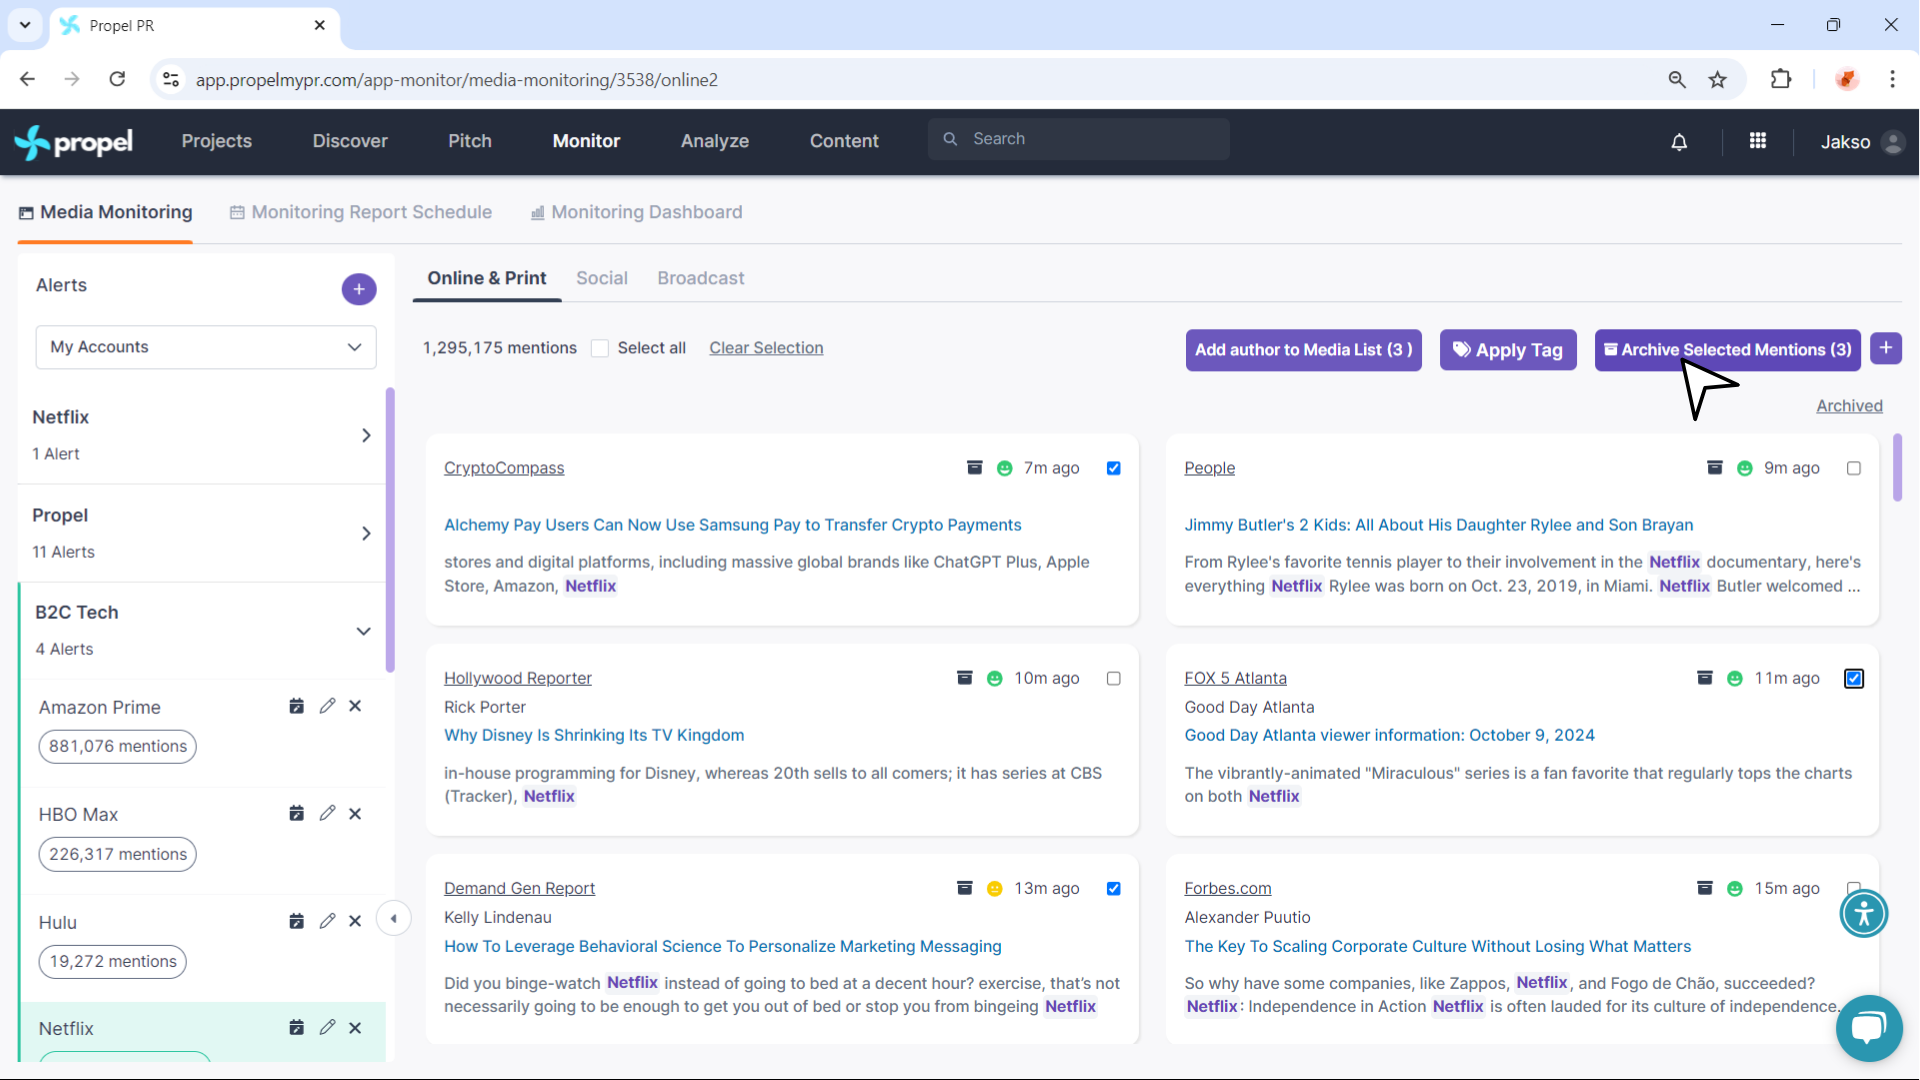
- Select mentions to archive.
- Click the Archive icon.
- Return to active mentions by clicking “Active”.
- Select mentions to archive.
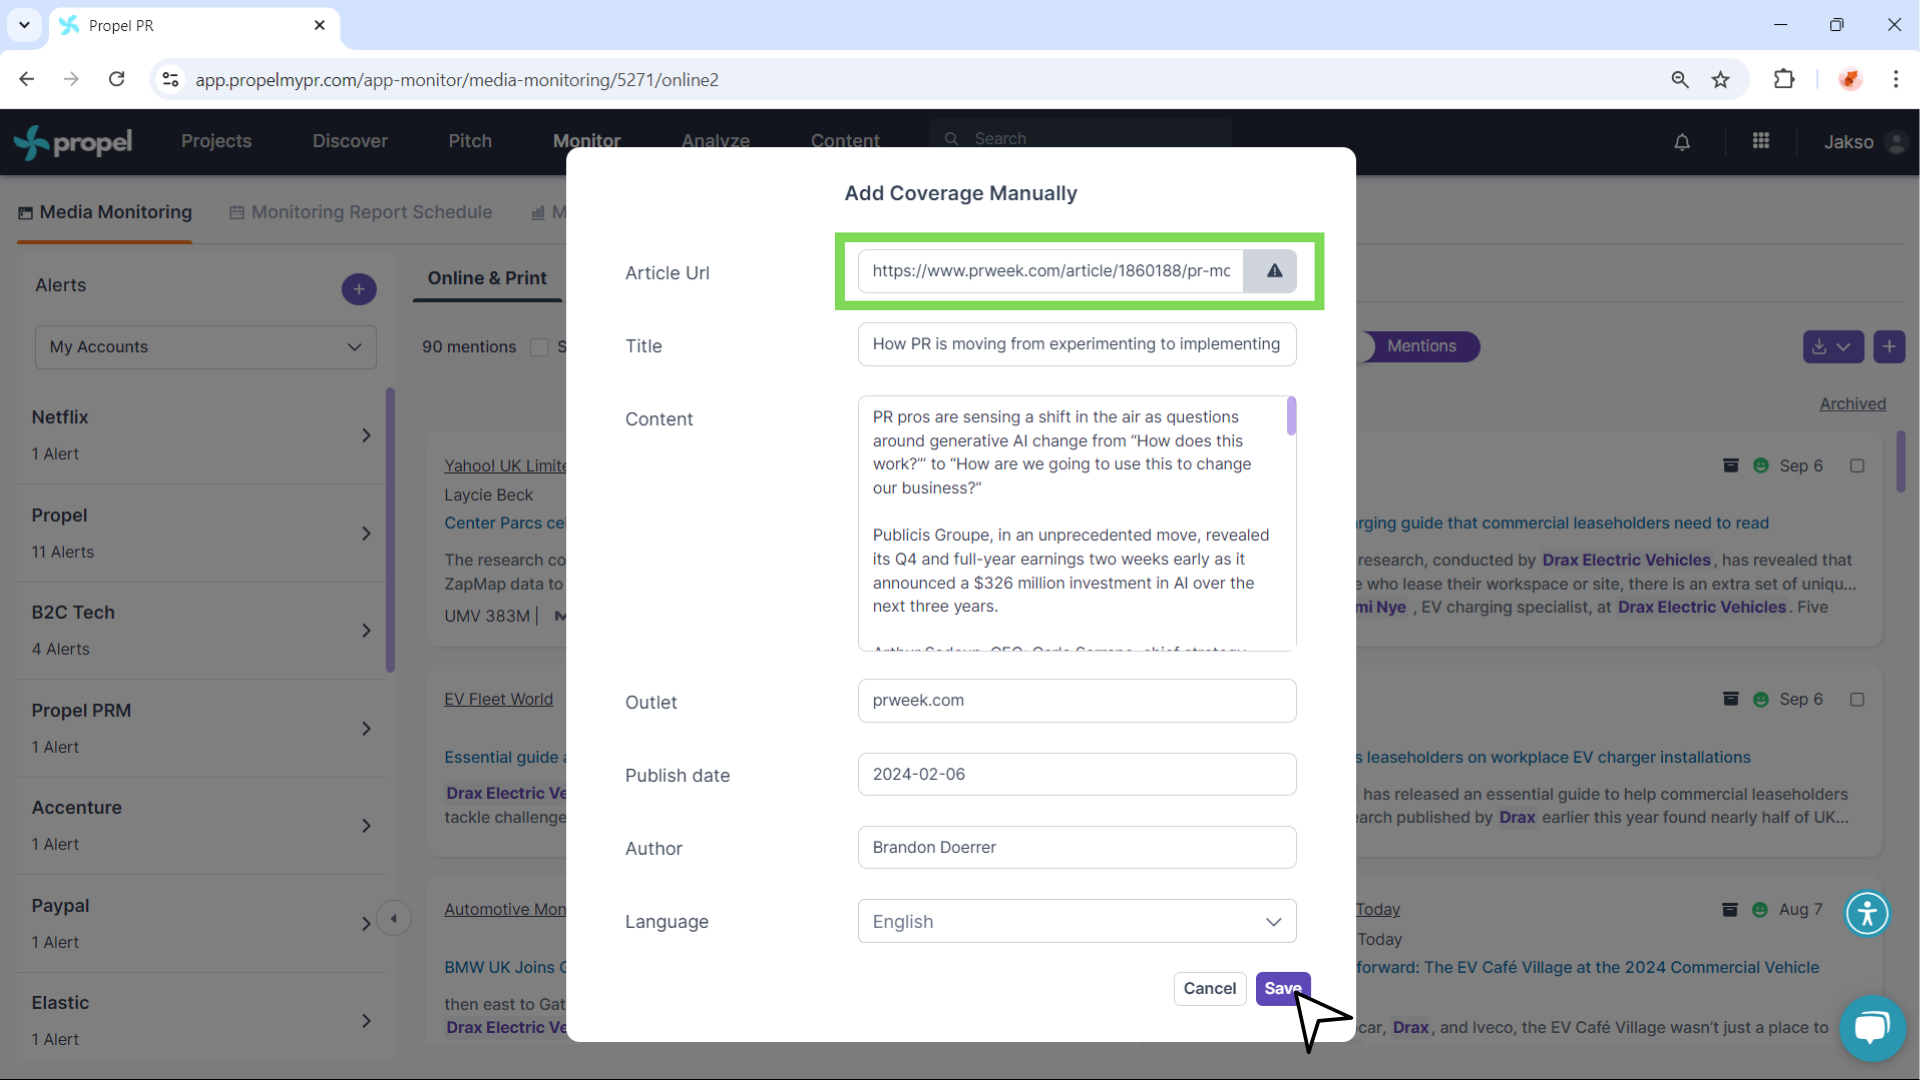
- Add Coverage Manually: Click the “Plus” icon and enter the article URL. Propel gathers the coverage details for you.
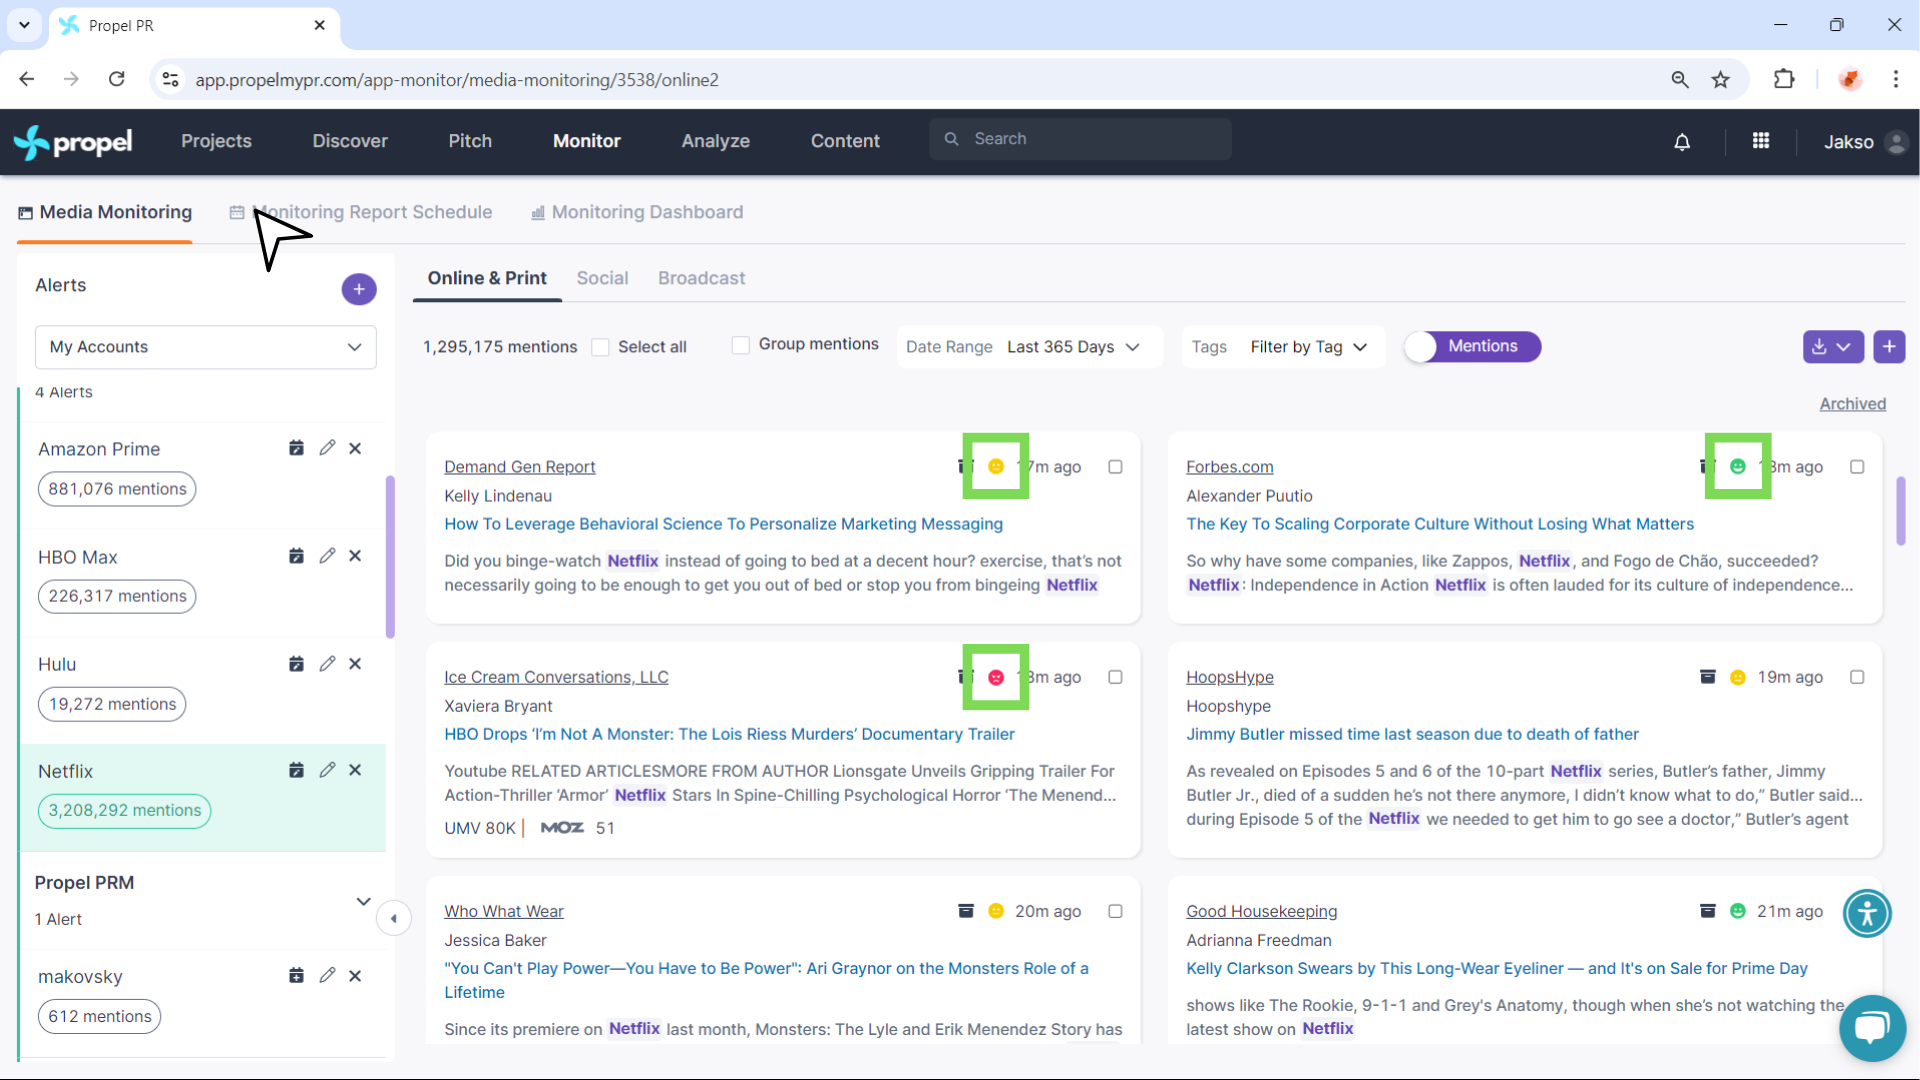
- Sentiment Analysis: Sentiment is color-coded:
- Green = Positive
- Yellow = Neutral
- Red = Negative
- Clickable Coverage and Outlet Links: Click the mention to view the article or the outlet to visit its homepage.
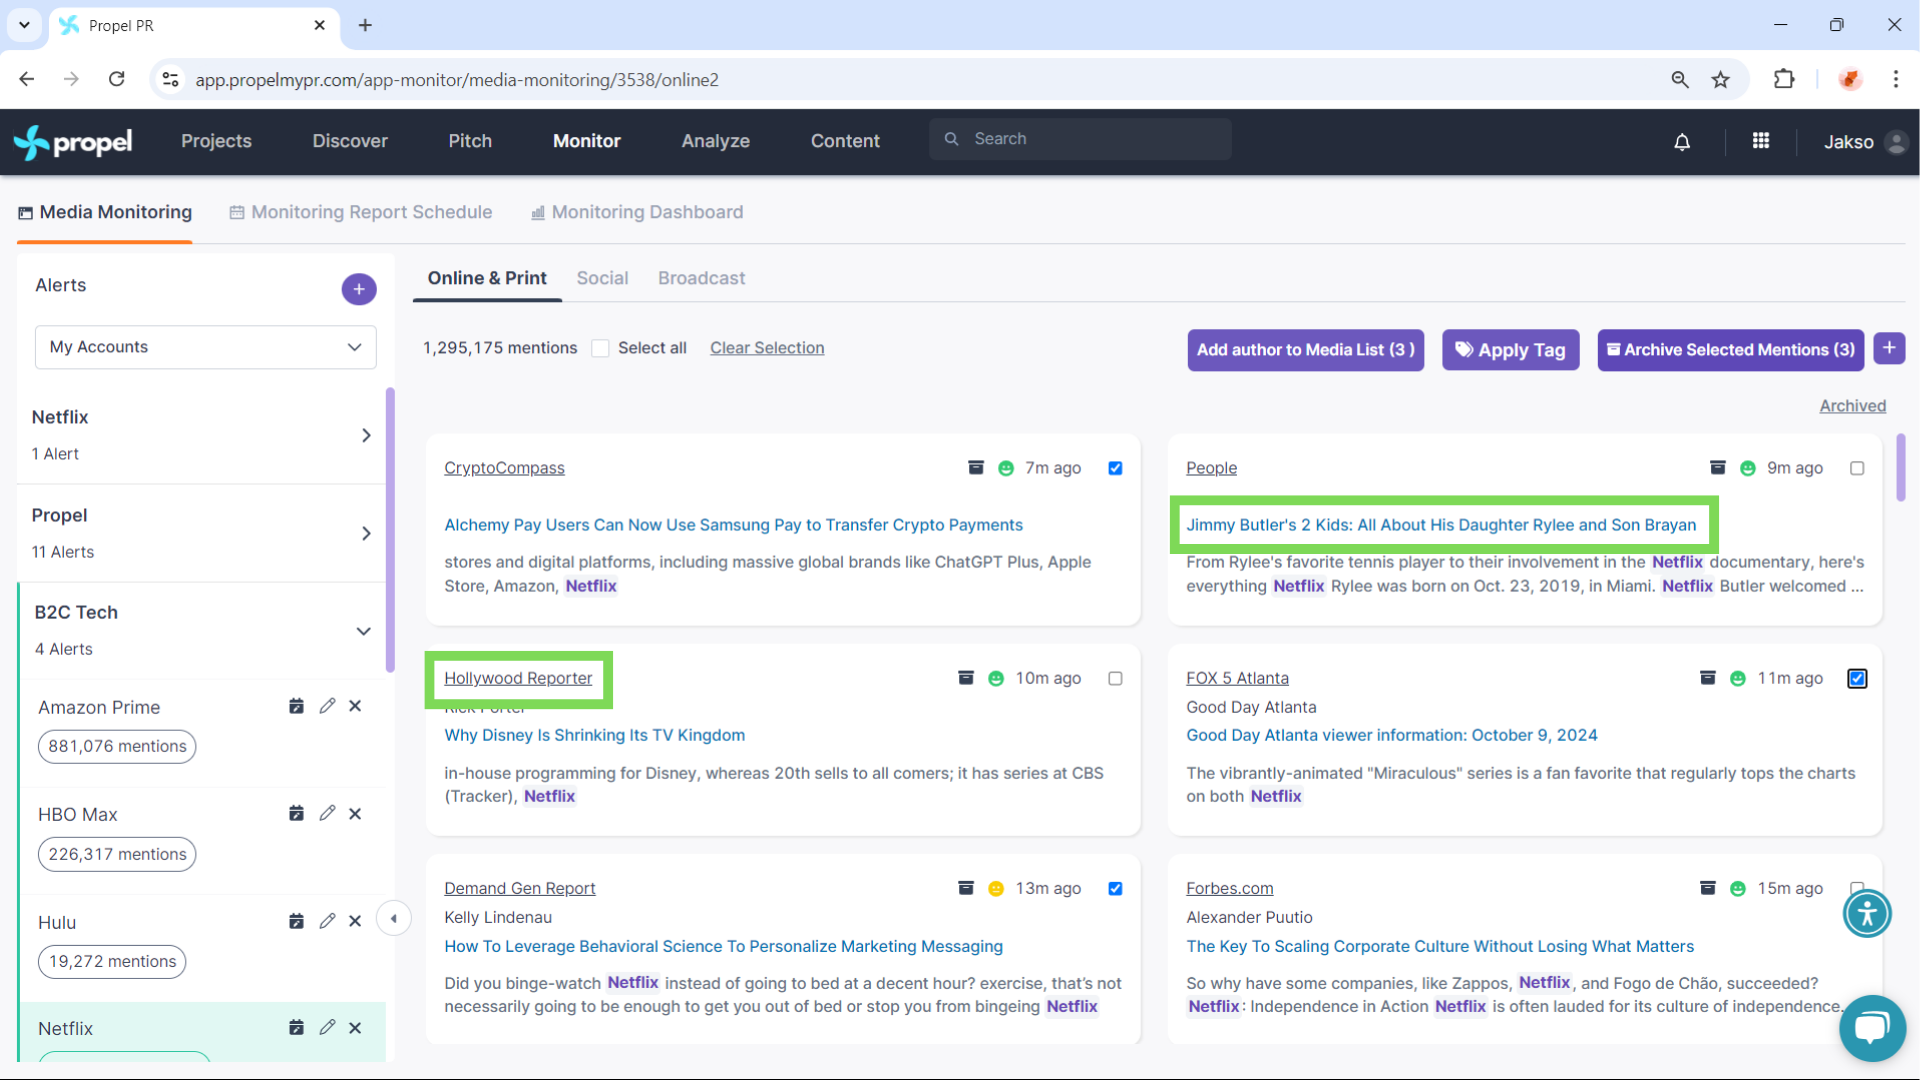
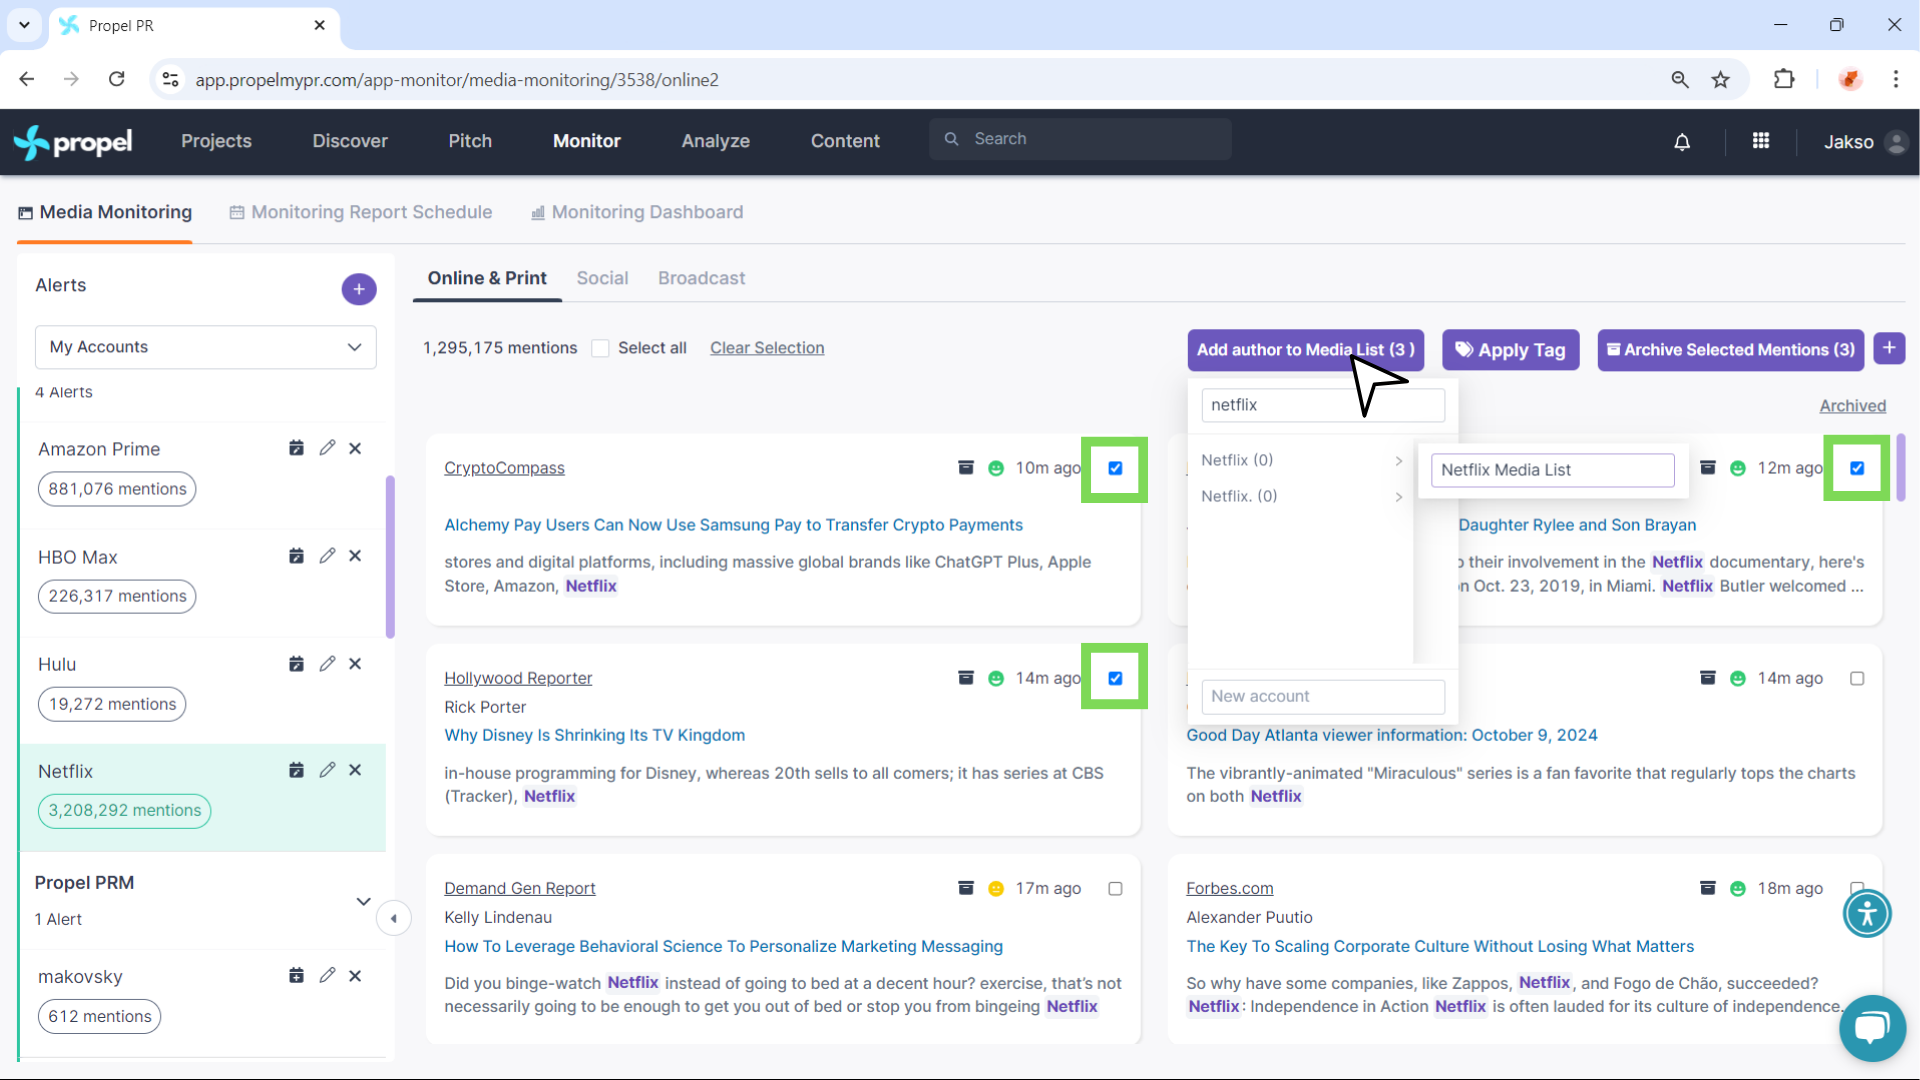
- Add Authors to Media Lists:
- Check the box on the mention’s card (you can select multiple).
- Select Add Author to Media List and choose an existing list or create a new one.
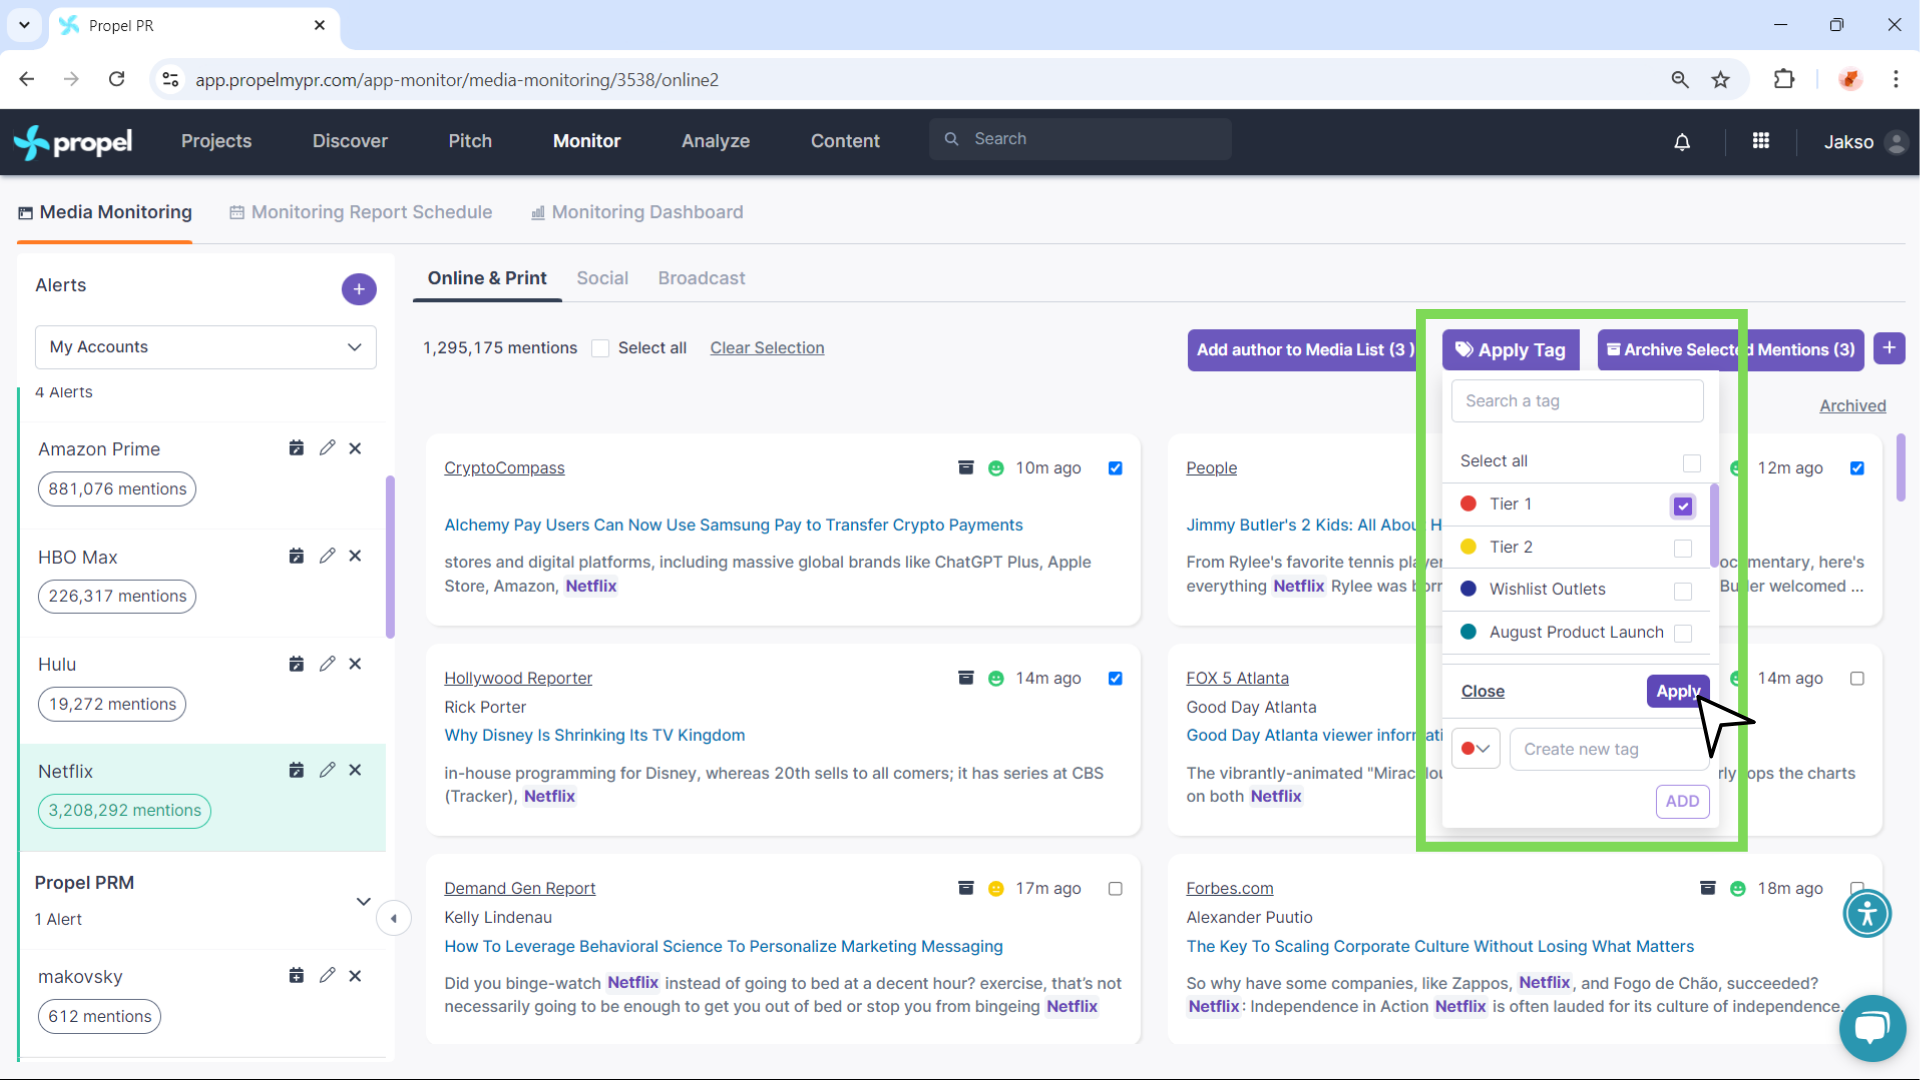
- Applying Tags:
- Select mentions and click “Apply Tag”.
- Create or select tags.
- Group Mentions: Remove syndicated duplicates by checking "Group Mentions" at the top of the dashboard.
- Filters and Timelines:
- Tags
- Date Range: Choose from predefined or custom ranges.
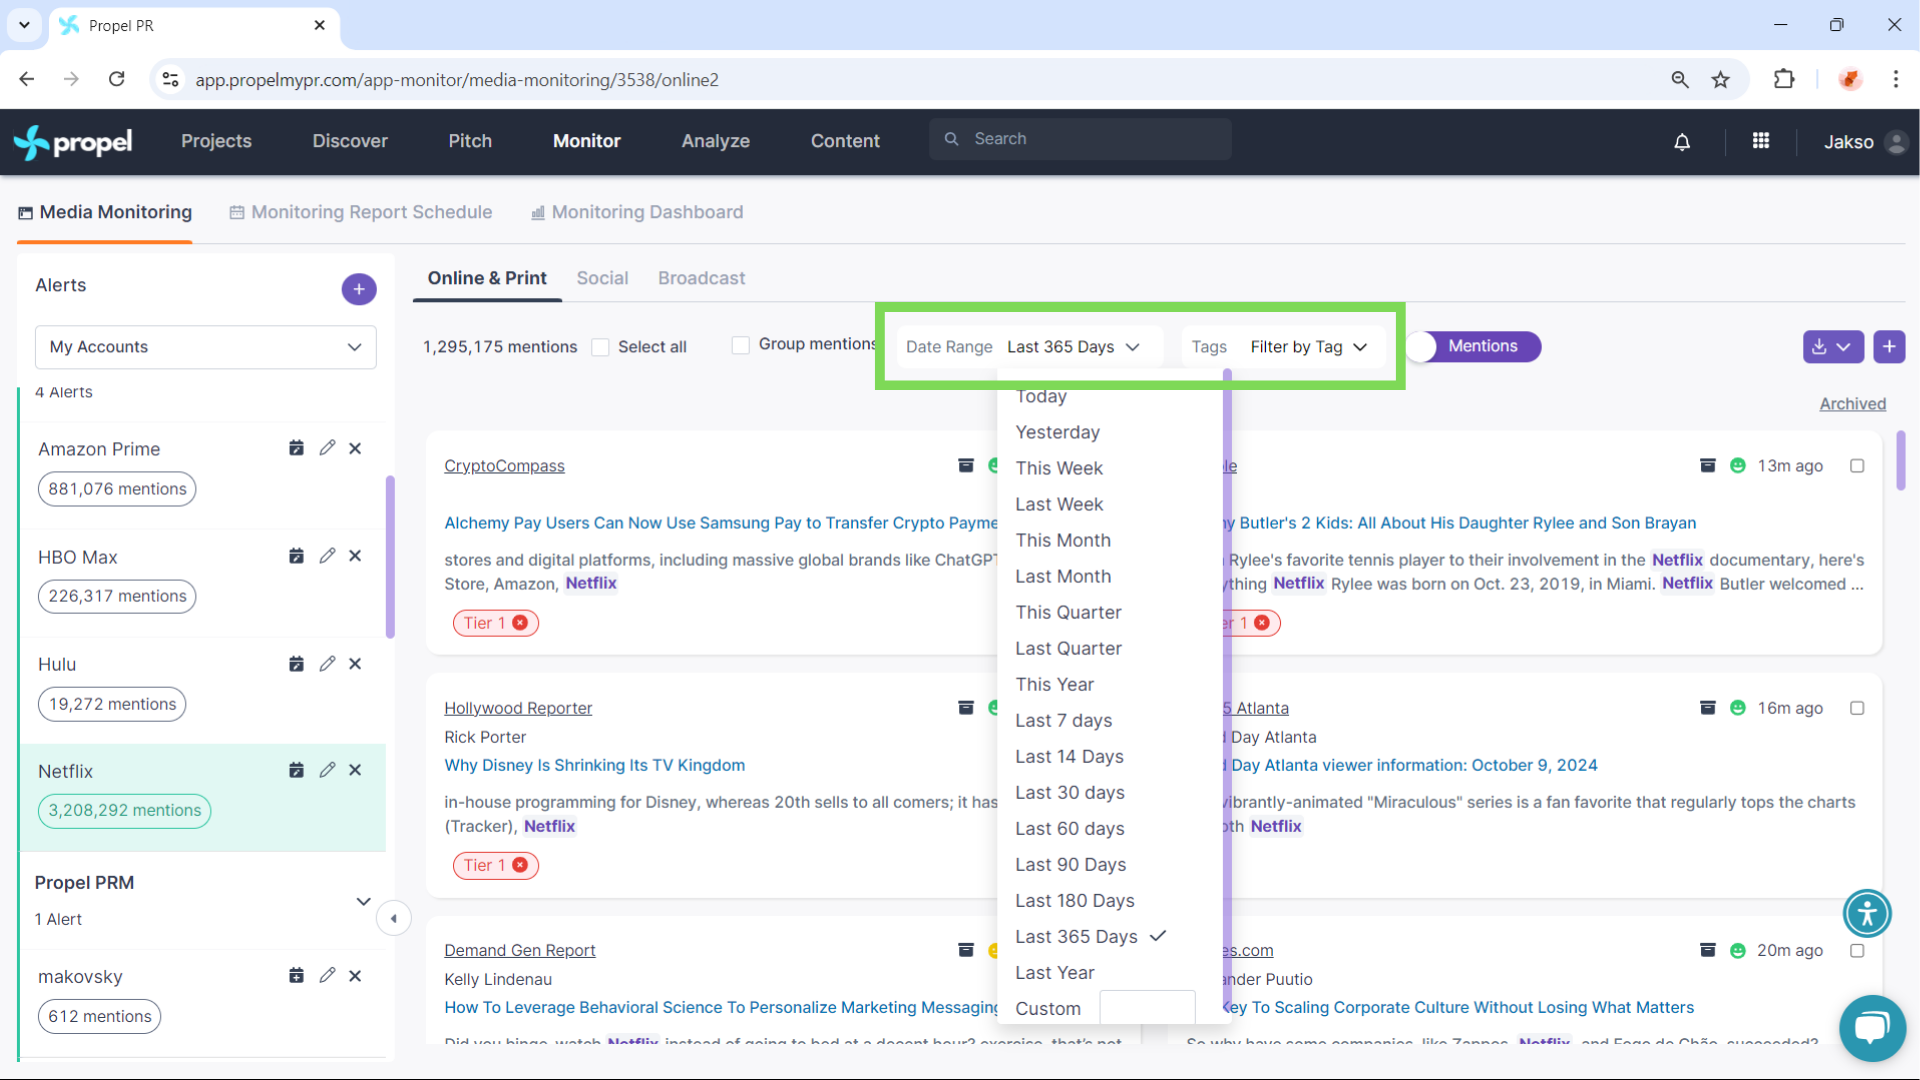
- Tags
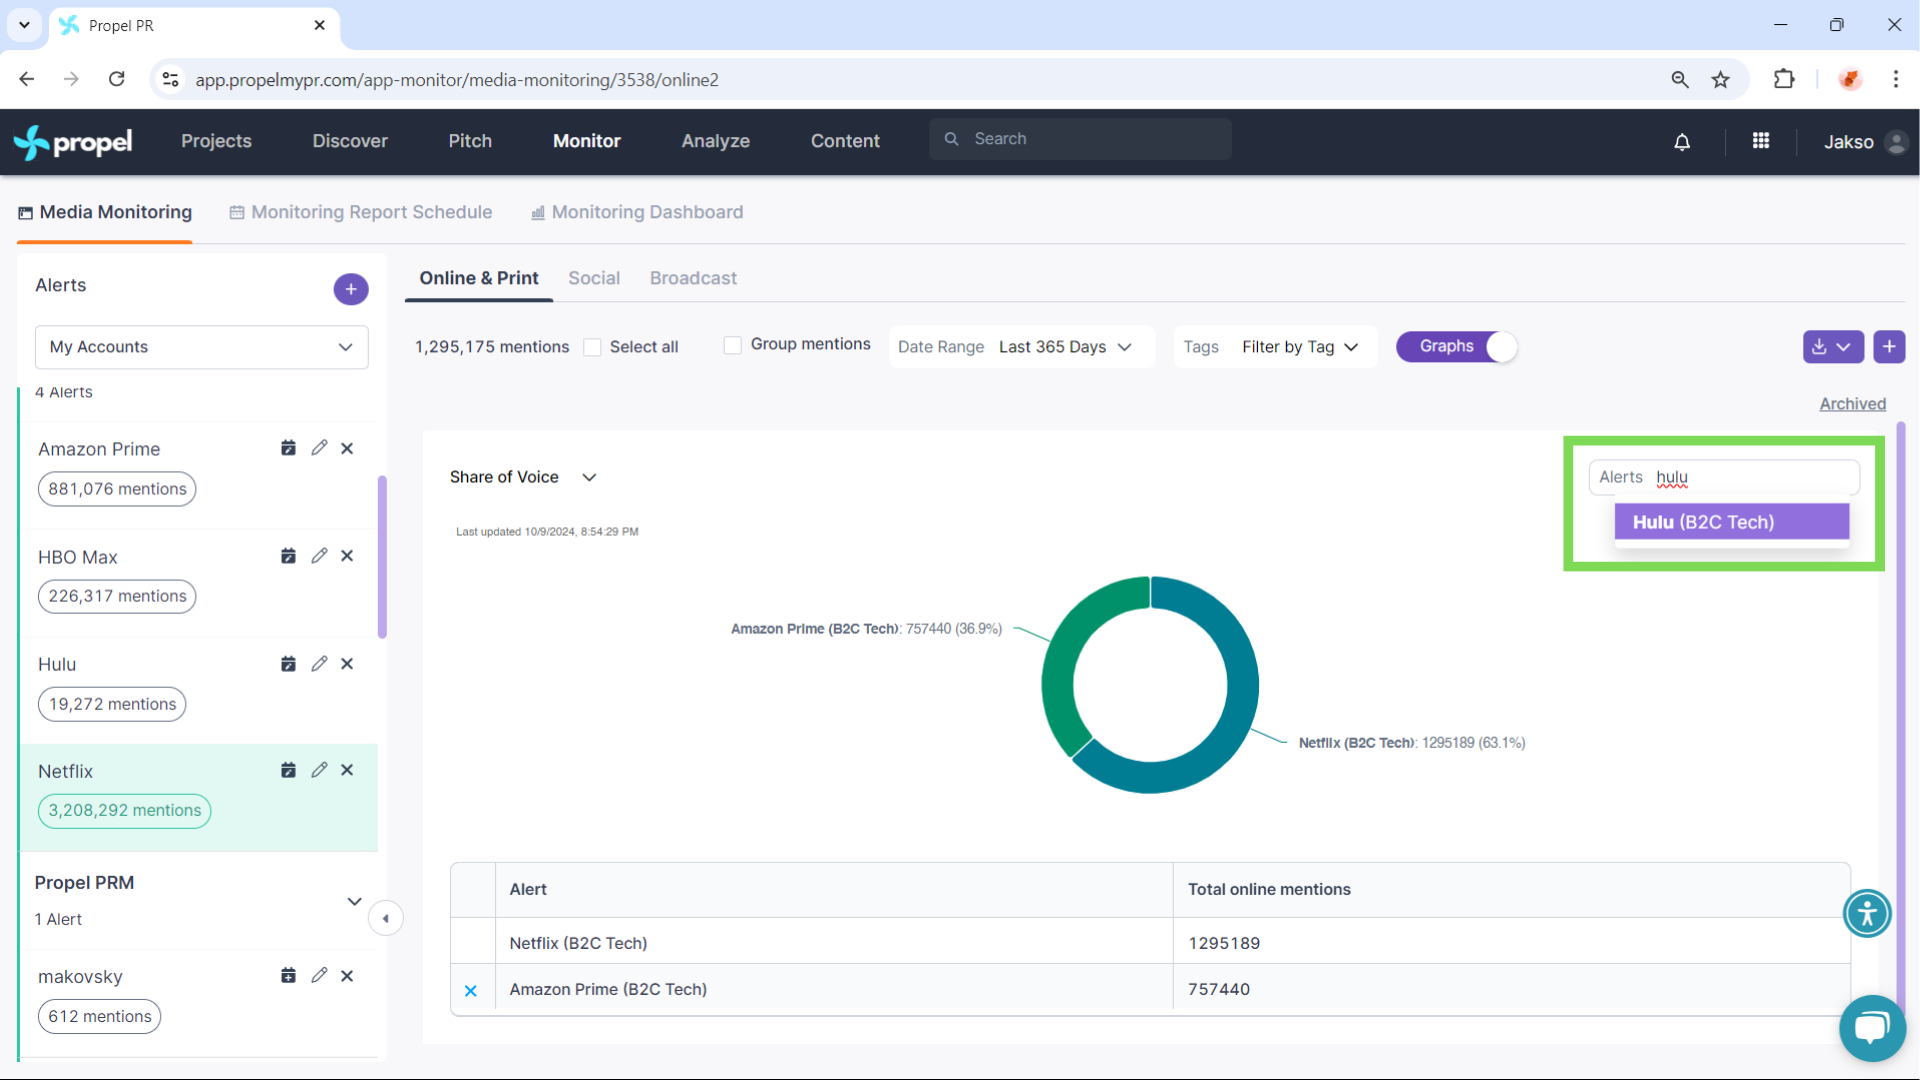
- Graph View: Visualize trends in media mentions.
- Volume over time
- Volume by rank
- Share of Voice
- Sentiment
- Volume by Online Source
You can also compare multiple alerts by typing their names in the “Alerts” field.
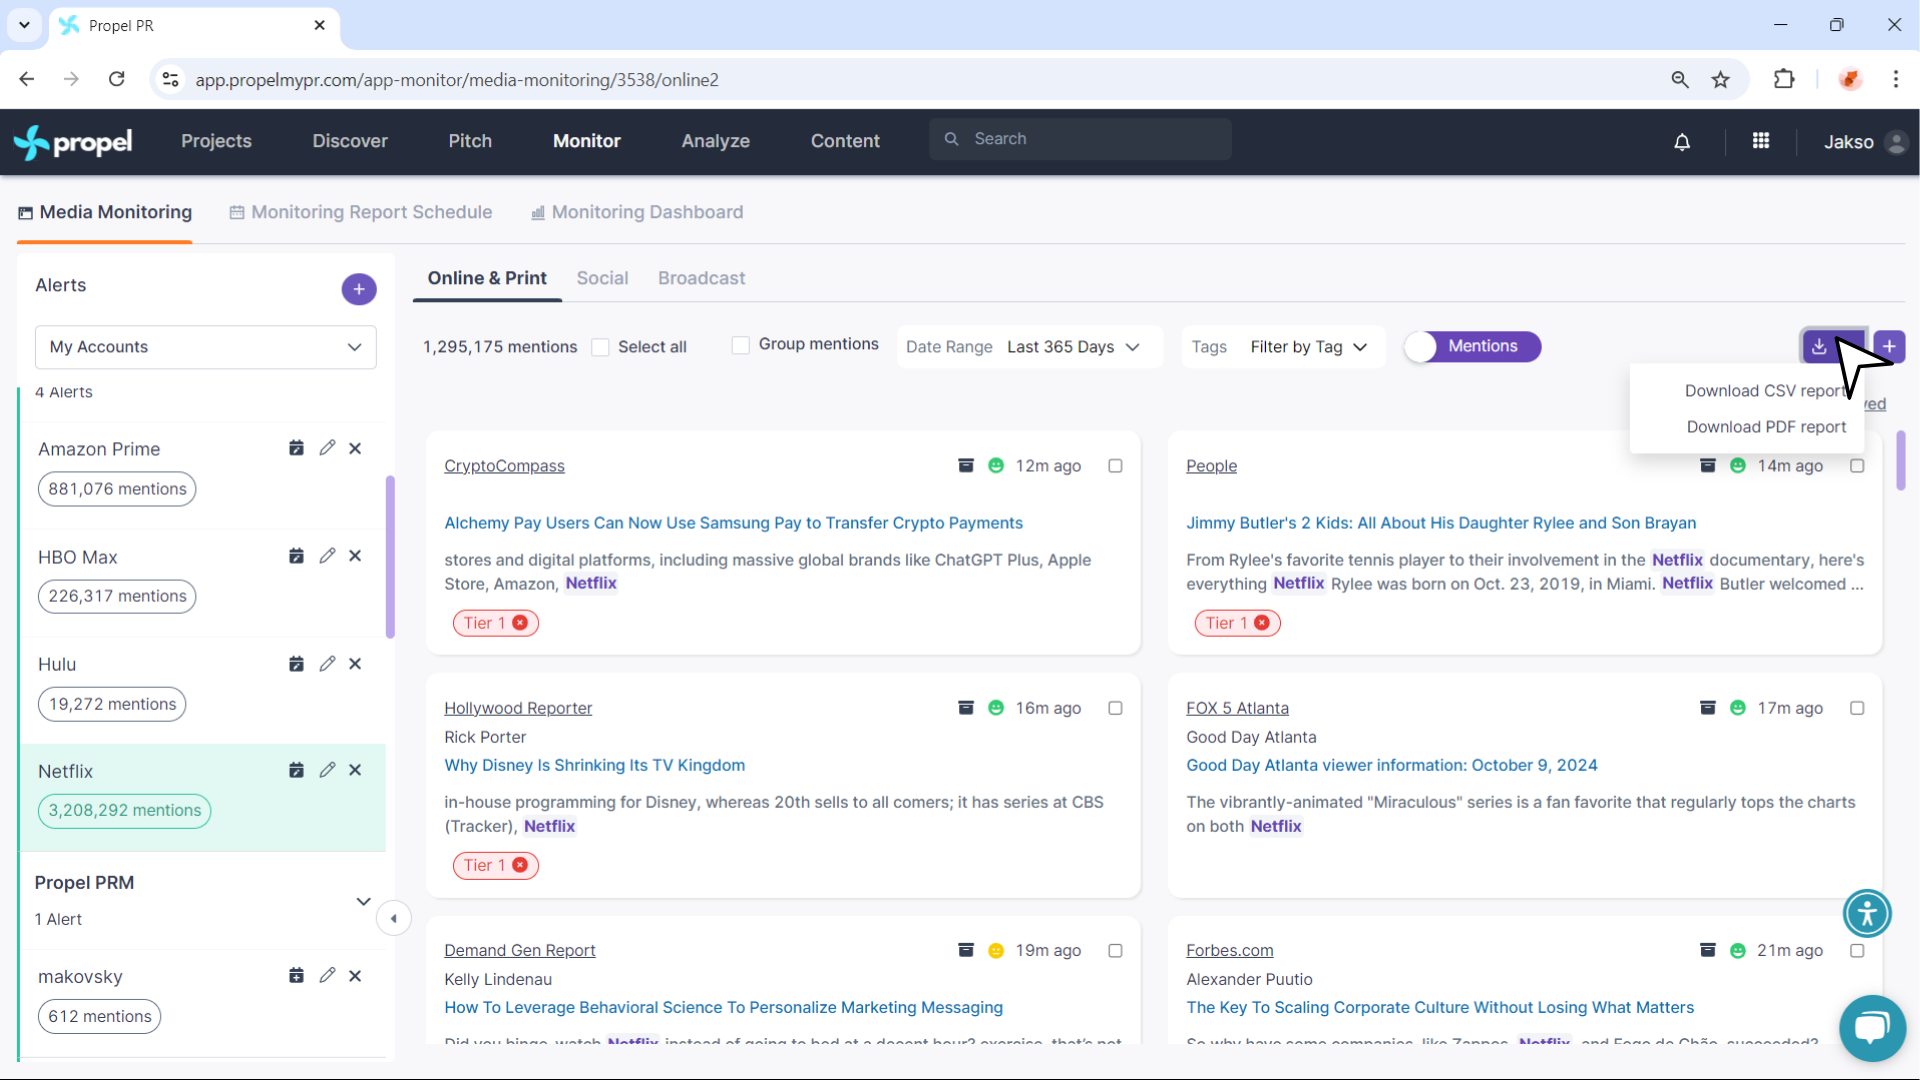
- Downloading Reports: From either “Mentions” or “Graph” view, click the download icon and choose PDF or CSV.
- Monitoring Dashboard: View all graphs in one place. You can:
- Compare alerts
- Filter by date or media type
- Group mentions
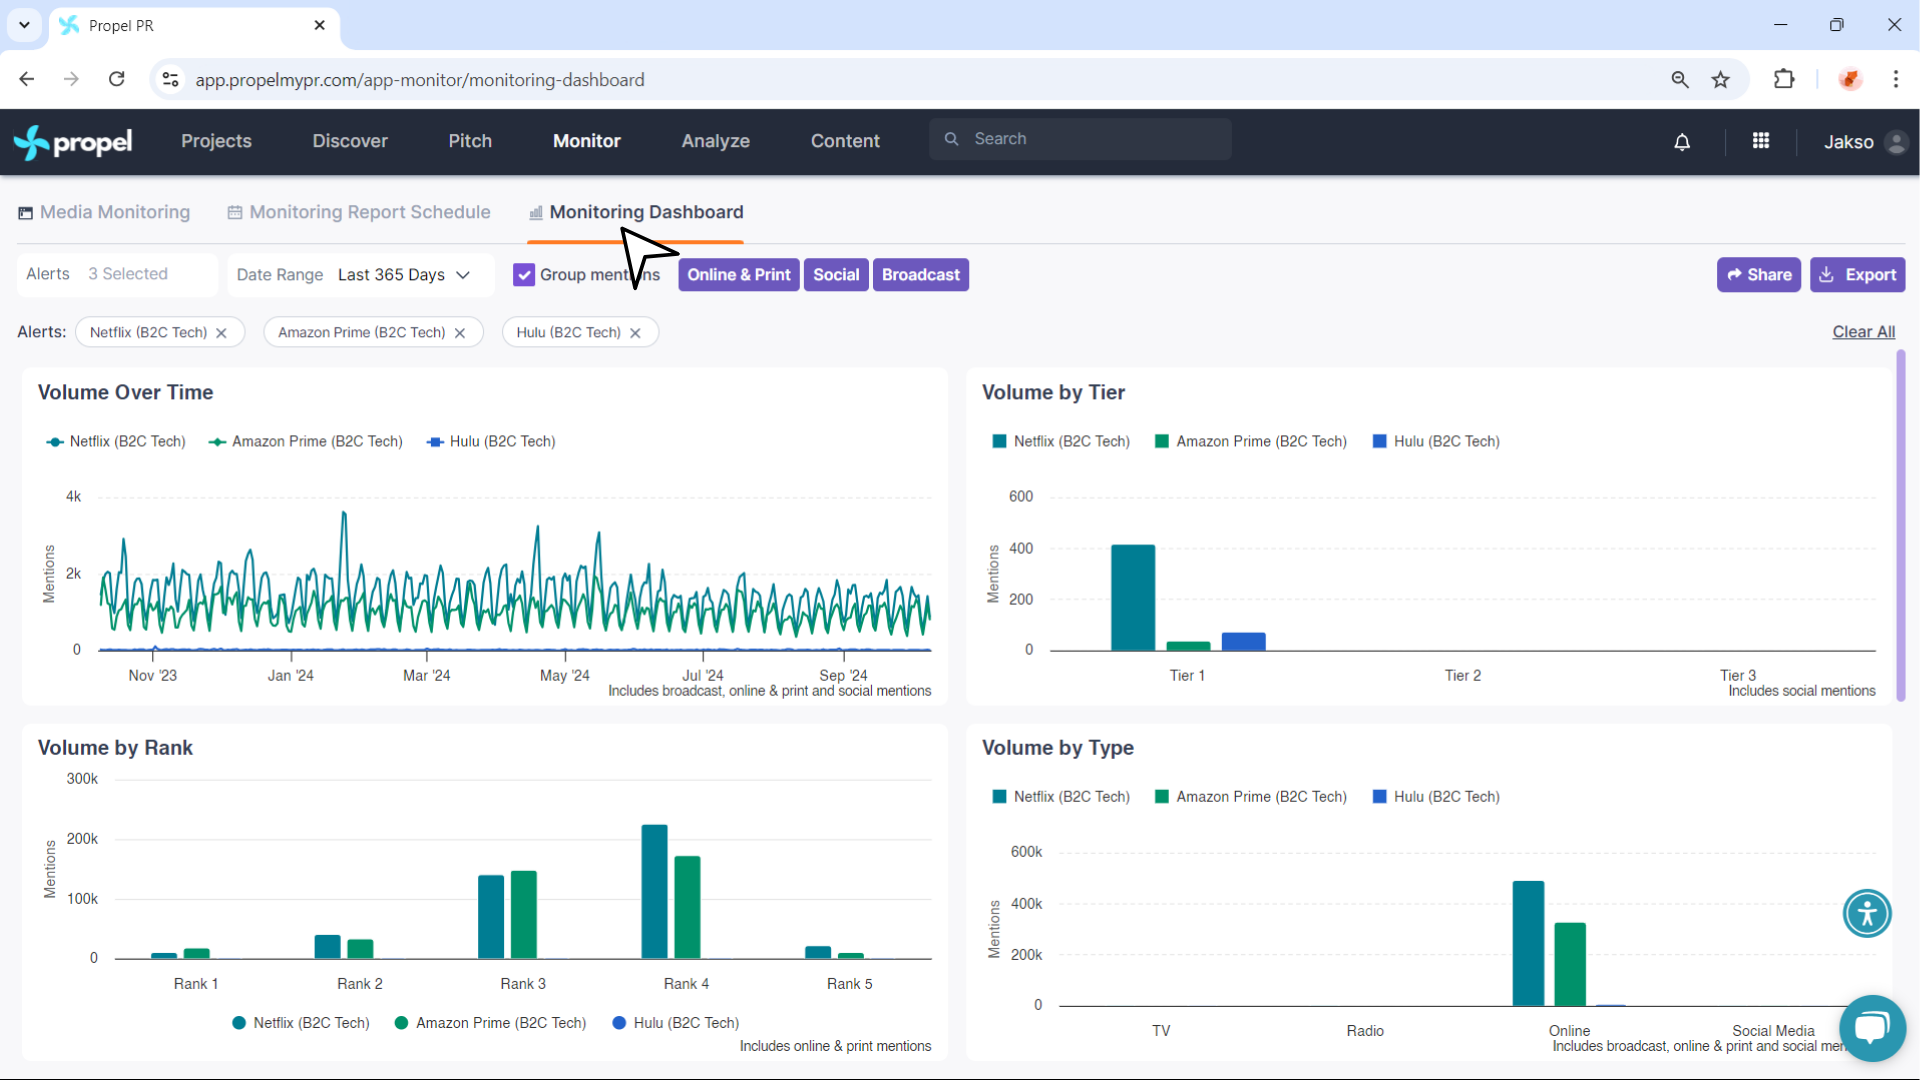
You can also share the live dashboard or export a PDF of all graphs using the Share and Export buttons.
If you edit the alert parameters, all graphs and mentions update automatically.
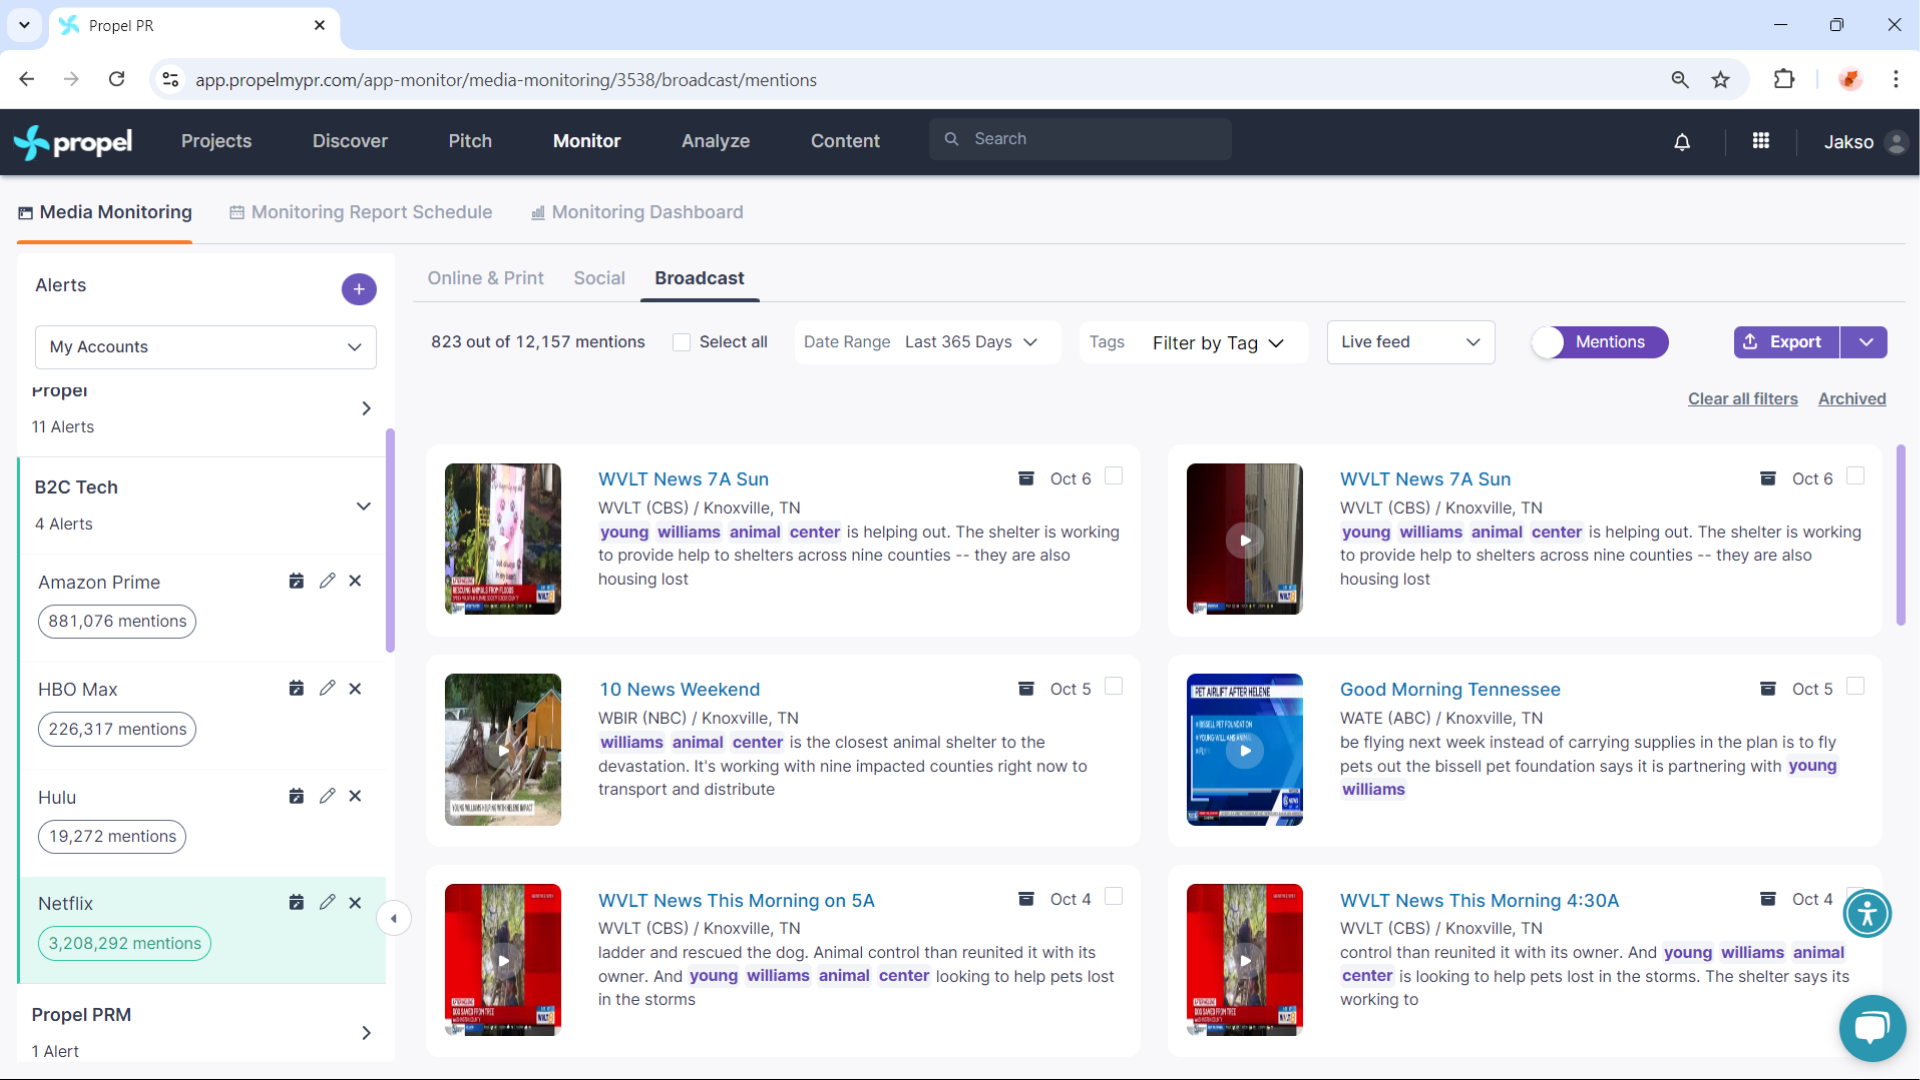
Monitoring Broadcast:
In the Broadcast tab, track mentions across radio and TV. You can also save clips to preserve valuable coverage. Click here to learn how to save clips.
Now you can track and analyze your media coverage effectively, ensuring you stay on top of your PR campaigns across all media types!